
Globalisation, technological revolution and a myriad of other phenomenon some of which are mere buzzwords – have contributed a world with infinite connectivity. True to its name – the World Wide Web has connected the world like a web. Integration of smart, intuitive and machine learning-based systems have further enhanced the connectivity. Now-a-days our phones and computers know exactly how we behave and can predict what we are going to search for and suggest us exactly.
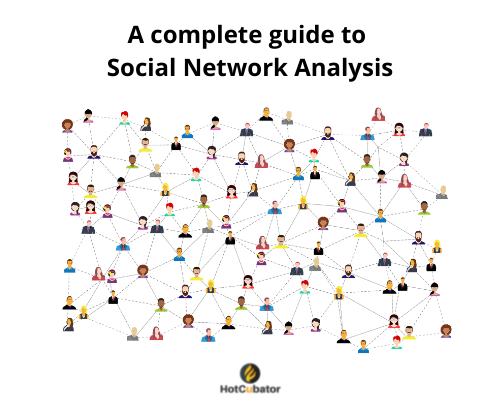
The whole world today has become a global village with everything accessible from the palm of our hands and a touch of a screen. As the world today is becoming more and more connected, it has become essential more than ever before to analyse the connected relationships and measure the strengths of the relationships from various perspectives. Social Network Analysis (SNA) has become a very effective and widely useful tool to analyse the networked relationships that exist among the actors and reactors in a relationship dynamic. The origin of SNA goes back as far as 1930s in the work of Jacob Moreno and Helen Jennings who introduced basic analytical methods. Later, there were many other scholars who enriched the field by extending the research in areas such as – business and management, sociology, social psychology, health, innovation, education, criminology, political science and many more. Since early 20th century SNA is widely used in – health networks, transport systems, website search engine architecture, social communities and a wide range of areas where it is important to draw association among the various actors and reactors. Now-days with the advent of numerous tools to perform network analysis, it has become very popular and widely used by data professionals to visualise and connect the networked relationships
Common properties in social network analysis –
In SNA, there are two main aspects – actors and relationships. To display the link between the various actors and their relationships there are several indicators which are described below –
Nodes –
Nodes are the number of points that are connected by links.
Edge
There are two types of edges – directed and undirected. Directed edges are applied from one node to another with a starting node and an ending node. In undirected edges – there is no starting node or ending node – rather, a simple connection between two nodes.
Edge Weight
An Edge’s weight is the number of times that edge appears between two specific nodes.
Degree
A node’s degree is the number of edges the node has. In an undirected network, there is only one measure for degree.
Closeness
Closeness measures how well connected a node is to every other node in the network.
Betweenness
Betweenness measures the importance of a node’s connections in allowing nodes to reach other nodes.
Network Size
Network size is the number of nodes in the network.
Network Density
Network density is the number of edges divided by the total possible edges.
Centrality Measures
Centrality is a collection of metrics used to quantify how important and influential a specific node is to the network as a whole.
Types of graphs in SNA
Through SNA, it is possible to create some amazing and very effective graphs and diagrams to visualise the networked relationships. Here are some popular graph types according to their usage –
Dendrogram –
When it comes to allocating various objects under a specific cluster then a Dendrogram is created. In other words, Dendrograms, show the hierarchical relationship between objects. It is most commonly created as an output from hierarchical clustering.
SankeyNetwork
Some graphs and diagrams in SNA are particularly useful in specific sectors. For example, Sankey diagrams are widely used in science and engineering to represent heat balance, energy flows, material flows. One of the main purposes of Sankey diagrams is to display the life-cycle assessments. Sankey diagrams appear as flow diagram in which the width of the arrows is proportional to the flow rate. Sankey diagrams emphasize the major transfers or flows within a system. They help locate the most important contributions to a flow. They often show conserved quantities within defined system boundaries.
Forced Network
Force-directed graph drawing algorithms are a class of algorithms for drawing graphs in an aesthetically-pleasing way. Their purpose is to position the nodes of a graph in two-dimensional or three-dimensional space so that all the edges are of more or less equal length and there are as few crossing edges as possible, by assigning forces among the set of edges and the set of nodes, based on their relative positions, and then using these forces either to simulate the motion of the edges and nodes or to minimize their energy.
Radial Network
A radial tree, or radial map, is a method of displaying a tree structure in a way that expands outwards, radially.
Arc diagram
The arc diagram is a style of graph drawing, in which the vertices of a graph are placed along a line in the Euclidean plane, with edges being drawn as semicircles in one of the two halfplanes bounded by the line, or as smooth curves formed by sequences of semicircles.
Chord diagram
The Chord diagrams also allows to study flows between a set of entities. Entities (nodes) are displayed all around a circle and connected with arcs (links).
Software/programs used for Social Network Analysis
There are hundreds if not thousands of tools through which you can perform social network analysis. various programs through which SNA can be conducted.
AllegroGraph
AllegroGraph is a graph database. It is disk-based, fully transactional OLTP database that stores data structured in graphs rather than in tables. AllegroGraph includes a Social Networking Analytics library. AllegroGraph employs a combination of document (JSON and JSON-LD) and graph technologies that process data with contextual and conceptual intelligence. Knowledge Graphs built on the AllegroGraph platform are able to run queries of unprecedented complexity to support predictive analytics that help companies make better, real-time decisions.
Gephi
Gephi is Photoshop for graphs. It is an interactive visualisation and exploration tool that uses a 3D render engine to display large networks in real-time and to speed up the exploration for all kinds of networks and complex systems.
R
R undoubtedly is one of the best tools to perform social network analysis. R contains a variety of packages that are capable of performing a wide variety of network analysis. Here are some examples –
igraph is a generic network analysis package;
Network3D is capable of creating javascript based dynamic graphs.
hergm implements hierarchical exponential random graph models;
tnet performs analysis of weighted networks, two-mode networks, and longitudinal networks;
Bergm provides tools for Bayesian analysis for exponential random graph models;
sna performs sociometric analysis of networks;
PAFit can analyse the evolution of complex networks by estimating preferential attachment and node fitness;
ergm is a set of tools to analyze and simulate networks based on exponential random graph models exponential random graph models;
RSiena allows the analyses of the evolution of social networks using dynamic actor-oriented models;
Tulip
Tulip is an information visualization framework dedicated to the analysis and visualization of relational data. Tulip aims to provide the developer with a complete library, supporting the design of interactive information visualization applications for relational data that can be tailored to the problems he or she is addressing.
NetworkX
NetworkX is a Python package for the creation, manipulation, and study of the structure, dynamics, and functions of complex networks.
Sources:
https://towardsdatascience.com/how-to-get-started-with-social-network-analysis-6d527685d374
https://www.jessesadler.com/post/network-analysis-with-r/
https://en.wikipedia.org/wiki/Social_network_analysis
https://www.researchgate.net/publication/239228599_The_Development_of_Social_Network_Analysis
Related posts:
 How to Prepare for a Higher Degree Research Study in Australia
 Program Evaluation Canvas – a new way to portray program evaluation
 What is Univariate, Bivariate and Multivariate analysis?
 Reliability in Qualitative Research
 A Complete Guide to Conduct Focus Group Interviews
 What is Narrative Interview?
 A complete guide to sampling techniques
 A complete guide to Literature Review