
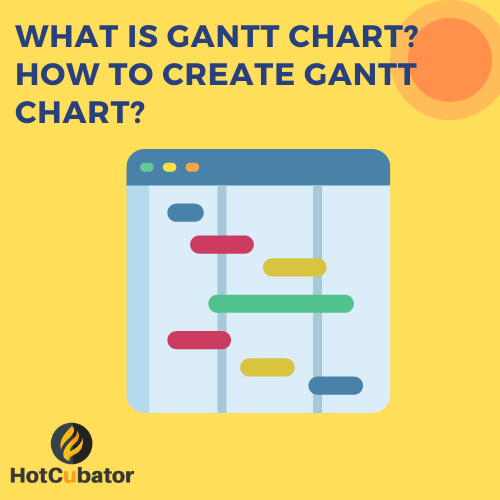
A Gantt chart is a popular project management tool used to visualize and track the progress of tasks over time. It provides a graphical representation of a project schedule, displaying the start and end dates of each task and their dependencies. Gantt charts are widely used in various industries to plan, monitor, and communicate project timelines effectively.
History of Gantt Chart:
The Gantt chart was developed by an American engineer and management consultant named Henry Gantt in the early 20th century. Gantt was working with the Bethlehem Steel Corporation and wanted a visual tool to improve the scheduling and coordination of complex projects.
In the early 1910s, Gantt developed the chart as a means to represent project schedules using horizontal bars. He introduced the concept of a bar chart that displayed the start and end dates of project tasks. Gantt charts quickly gained popularity for their ability to simplify project planning and scheduling.
Gantt’s work gained significant recognition during World War I when the U.S. government used his charts to manage and coordinate the production of military equipment. Since then, Gantt charts have become a fundamental tool in project management, helping teams to plan, track, and complete projects efficiently.
Gantt charts offer several benefits in project management:
- Visual representation: Gantt charts provide a clear and visual representation of project tasks, timelines, and dependencies. This makes it easier for team members and stakeholders to understand the project’s overall schedule and progress at a glance.
- Task scheduling and coordination: Gantt charts allow project managers to schedule tasks effectively and coordinate dependencies between tasks. By visually mapping out task durations and interdependencies, teams can better plan their work and ensure a smooth flow of activities.
- Resource allocation: Gantt charts help in allocating resources efficiently by providing a comprehensive overview of task durations and resource requirements. Project managers can identify potential resource conflicts or bottlenecks and make necessary adjustments to optimize resource allocation.
- Timeline management: Gantt charts enable project managers to set realistic timelines and deadlines for tasks. By visualizing the project schedule, they can identify critical paths, prioritize tasks, and allocate resources accordingly, ensuring timely project completion.
- Progress tracking: Gantt charts facilitate tracking project progress in real-time. As tasks are completed, they can be marked as such on the chart, allowing teams to visualize completed work and understand the remaining tasks. This helps in monitoring project status and identifying any delays or issues early on.
- Communication and collaboration: Gantt charts serve as a communication tool between team members, stakeholders, and clients. They provide a common visual language for discussing project timelines, milestones, and progress, fostering collaboration and enhancing overall project transparency.
- Risk management: Gantt charts assist in identifying potential risks and managing them effectively. By visualizing task dependencies and critical paths, project managers can anticipate potential delays or bottlenecks and develop contingency plans to mitigate risks.
- Stakeholder engagement: Gantt charts are valuable for engaging stakeholders and keeping them informed about project timelines and progress. They provide a visual representation that is easily understandable and accessible to non-technical stakeholders, enabling effective communication and stakeholder buy-in.
Overall, Gantt charts contribute to improved project planning, organization, and execution. They enhance team productivity, facilitate effective communication, and increase the chances of project success by providing a clear roadmap for project completion.
How to create a Gantt Chart:
Creating a Gantt chart can be done using various software tools or even manually using pen and paper. Here’s a general approach to creating a Gantt chart:
- Identify tasks: Start by identifying all the tasks required to complete your project. Break down the project into smaller, manageable tasks.
- Define dependencies: Determine the dependencies between tasks, i.e., which tasks need to be completed before others can begin. This helps establish the order and sequence of tasks.
- Determine task duration: Estimate the time required to complete each task. This can be done in days, weeks, or months, depending on the project’s scale and complexity.
- Create a timeline: Set up a horizontal timeline that represents the project’s duration. This can be in the form of days, weeks, or months, depending on your project’s timeframe.
- Add task bars: For each task, create a horizontal bar along the timeline. The length of the bar represents the task duration, and its position indicates the start and end dates.
- Connect dependencies: Use arrows or lines to connect dependent tasks. This visually represents the order in which tasks need to be completed.
- Include milestones: Add milestones to mark significant points or achievements in the project. Milestones represent key events or deadlines.
- Add task details: Optionally, you can include additional information about each task, such as task owners, resources required, and task descriptions.
- Update and track progress: As the project progresses, update the Gantt chart by marking completed tasks and adjusting the timeline if necessary. This helps track the project’s status and identify any delays or potential bottlenecks.
While creating a Gantt chart manually can be time-consuming, there are numerous project management software tools available that provide Gantt chart functionality, making it easier to create, update, and share Gantt charts collaboratively.
Here are some widely used tools for creating Gantt charts:
- Microsoft Project: Microsoft Project is a comprehensive project management software that allows users to create, manage, and track projects, including the creation of Gantt charts. It offers robust features for scheduling, resource management, and collaboration.
- Microsoft Excel: While Excel is primarily a spreadsheet program, it can be used to create basic Gantt charts. By utilizing Excel’s conditional formatting and bar chart features, you can manually create a Gantt chart template.
- GanttProject: GanttProject is a free, open-source project management software that specifically focuses on creating Gantt charts. It offers features for creating tasks, setting dependencies, and tracking progress. It is suitable for small to medium-sized projects.
- TeamGantt: TeamGantt is a web-based project management tool that specializes in Gantt charts. It provides a user-friendly interface, allowing teams to create and manage Gantt charts collaboratively. It offers features such as task scheduling, resource management, and file sharing.
- Smartsheet: Smartsheet is a cloud-based collaboration and project management tool that includes Gantt chart functionality. It offers a range of project management features, including task management, resource allocation, and real-time collaboration.
- Trello: Although Trello is primarily known as a kanban-style project management tool, it also offers Gantt chart extensions or integrations. By adding Gantt chart plugins or power-ups to Trello boards, you can visualize tasks and their timelines in a Gantt chart format.
- Asana: Asana is a popular project management and team collaboration tool that supports Gantt chart functionality through its Timeline feature. It allows users to create Gantt charts, set dependencies, and manage project schedules within the Asana platform.
- Wrike: Wrike is a versatile project management software that includes Gantt chart capabilities. It offers features such as task management, time tracking, and collaboration, making it suitable for teams of all sizes.
Related posts:
 What is ‘Stage Gate’ Process in Project Management?
 How to Manage Risks in Project Management?
 What is Strategic Communication? Types, Importance and Components of Strategic Communication explained.
 What is Project Guardrail in Project Management?
 What is a Project Charter? What MUST be included in a Project Charter?
 What is a Work Breakdown Structure (WBS) in Project Management?
 What is a Project Plan? How to prepare a Project Plan?
 What is Project Stage Gate? Process, Benefits and Examples of Project Stage Gate.