
Using statistics is considered as a vital component of program evaluation to build rigour and depth of analysis. The use of statistics in program evaluation, however, is dependent on many factors such as – evaluation question, type of the evaluation, availability of comparison group, evaluator’s capacity, availability of data etc. are used in a variety of ways to support evaluation endeavours. As a new evaluator you might be challenged with the variety of statistical methods that are available to choose from when it comes to matching evaluation and statistics. In this article, you will find all the various statistical techniques that could be matched with different types of evaluation.
Statistics in Process Evaluation
Process evaluation is the process of assessing the implementation and delivery of a program or intervention. The type of statistical technique used in process evaluation can vary depending on the specific evaluation question and the design of the evaluation. Some of the most common statistical techniques used in process evaluation include:
- Descriptive statistics: Descriptive statistics are used to summarise and describe the characteristics of the process data, such as the mean, median, and standard deviation. They can be used to describe the implementation and delivery of the program or intervention and to track changes over time.
- Surveys and questionnaires: Surveys and questionnaires are used to collect data on the implementation and delivery of the program or intervention. They can be used to assess the extent to which the program or intervention was implemented as intended, and to identify any barriers or facilitators to implementation.
- Content analysis: Content analysis is a technique used to analyse qualitative data such as text, images, and videos. It can be used to analyse program materials, such as manuals or training materials, to assess the extent to which they align with best practices or evidence-based standards.
- Data visualisation: Data visualisation techniques such as histograms, scatter plots, or Gantt charts can be used to depict process data concisely. They can be used to identify patterns and trends in the data, and to communicate the results of the process evaluation to a wide audience.
- Longitudinal data analysis: Longitudinal data analysis is used to analyse data that is collected over time. It can be used to track changes in process data over time, to test hypotheses about changes in the process, and to identify patterns and trends in the data.
Statistics in Outcome Evaluation
Outcome evaluation is the process of measuring the effect of a program or intervention on specific outcomes or outcomes of interests. The type of statistical technique used in outcome evaluation can vary depending on the specific research question and the design of the evaluation. Here are some statistical techniques that could be used in outcome evaluation:
- Inferential statistics: Inferential statistics are used to make inferences about a population based on a sample of data. They can be used to test hypotheses about the population mean or proportion, to compare means or proportions between groups, or to estimate parameters.
- Analysis of Variance (ANOVA): ANOVA is a statistical technique used to compare the means of multiple groups. It can be used to test hypotheses about the equality of means across groups and to identify which groups are different.
- Regression analysis: Regression analysis is used to model the relationship between a dependent variable and one or more independent variables. It can be used to make predictions, understand the relationship between variables, and estimate the effect of a program or intervention on an outcome.
- Multivariate techniques: Multivariate techniques such as factor analysis, principal component analysis, or structural equation modelling can be used to analyse multiple outcomes and variables simultaneously. They can be used to identify patterns and relationships in the data, and to identify the most important variables that influence the outcome.
- Longitudinal data analysis: Longitudinal data analysis is used to analyse data that is collected over time. It can be used to track changes in outcomes over time, to test hypotheses about changes in outcomes, and to identify patterns and trends in the data.
Statistics in Impact Evaluation
Impact evaluation is the process of measuring the effect of a program or intervention on a specific outcome. The type of statistical technique used in impact evaluation can vary depending on the specific research question and the design of the evaluation. Common statistical techniques used in impact evaluation include:
- Randomised Control Trials (RCTs): RCTs are widely considered the gold standard for impact evaluations as they can help establish causality. In an RCT, individuals or groups are randomly assigned to either a treatment group or a control group, and the effects of the treatment are measured by comparing outcomes between the two groups.
- Difference-in-Differences (DiD): DiD is a quasi-experimental design that compares the change in outcomes between a treatment group and a control group over time. It is commonly used to evaluate the impact of a policy change, and it helps to control for time-invariant unobserved characteristics.
- Regression Discontinuity Design (RDD): RDD is a quasi-experimental design that compares the outcomes of individuals who just meet or just miss a cut-off point for a program or treatment. It helps to control for selection bias, and it’s commonly used to evaluate the impact of policies that have a clear eligibility criteria.
- Propensity Score Matching (PSM): PSM is a quasi-experimental design that matches individuals in a treatment group with individuals in a control group based on observed characteristics. It helps to control for selection bias, and it’s commonly used when randomisation is not possible.
- Synthetic Control Method (SCM): SCM is a quasi-experimental design that creates a synthetic control group for a treated unit by weighting the average outcomes of similar non-treated units. It’s commonly used to evaluate the impact of policy changes and it helps to control for time-invariant unobserved characteristics.
As evaluator, you should keep in mind that evaluation should be free of bias and be more tailored to the nature of the evaluation in question. The evaluation question and data availability should be given highest priority and then ensure that the most appropriate statistical technique is adopted, so that an objective and accurate outcome is achieved from the evaluation project.
References:
https://onlinelibrary.wiley.com/doi/abs/10.1002/9781119171386.ch23
https://www.abs.gov.au/ausstats/abs@.nsf/lookup/1500.0chapter42010
Related posts:
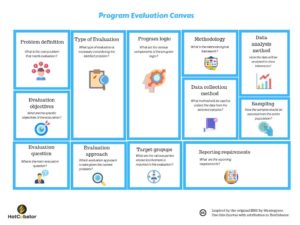 Program Evaluation Canvas – a new way to portray program evaluation
 What is the difference between Evaluation and Research?
 How to write an Evaluation report
 What is Program evaluation?
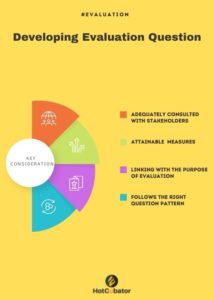 How to prepare program evaluation questions?
 What is an Evaluation Readiness Assessment?
 What is a Program Logic? Why it is important to have a Program Logic in an Evaluation project?
 Importance of having the right EVALUATION approach.